
Information Design
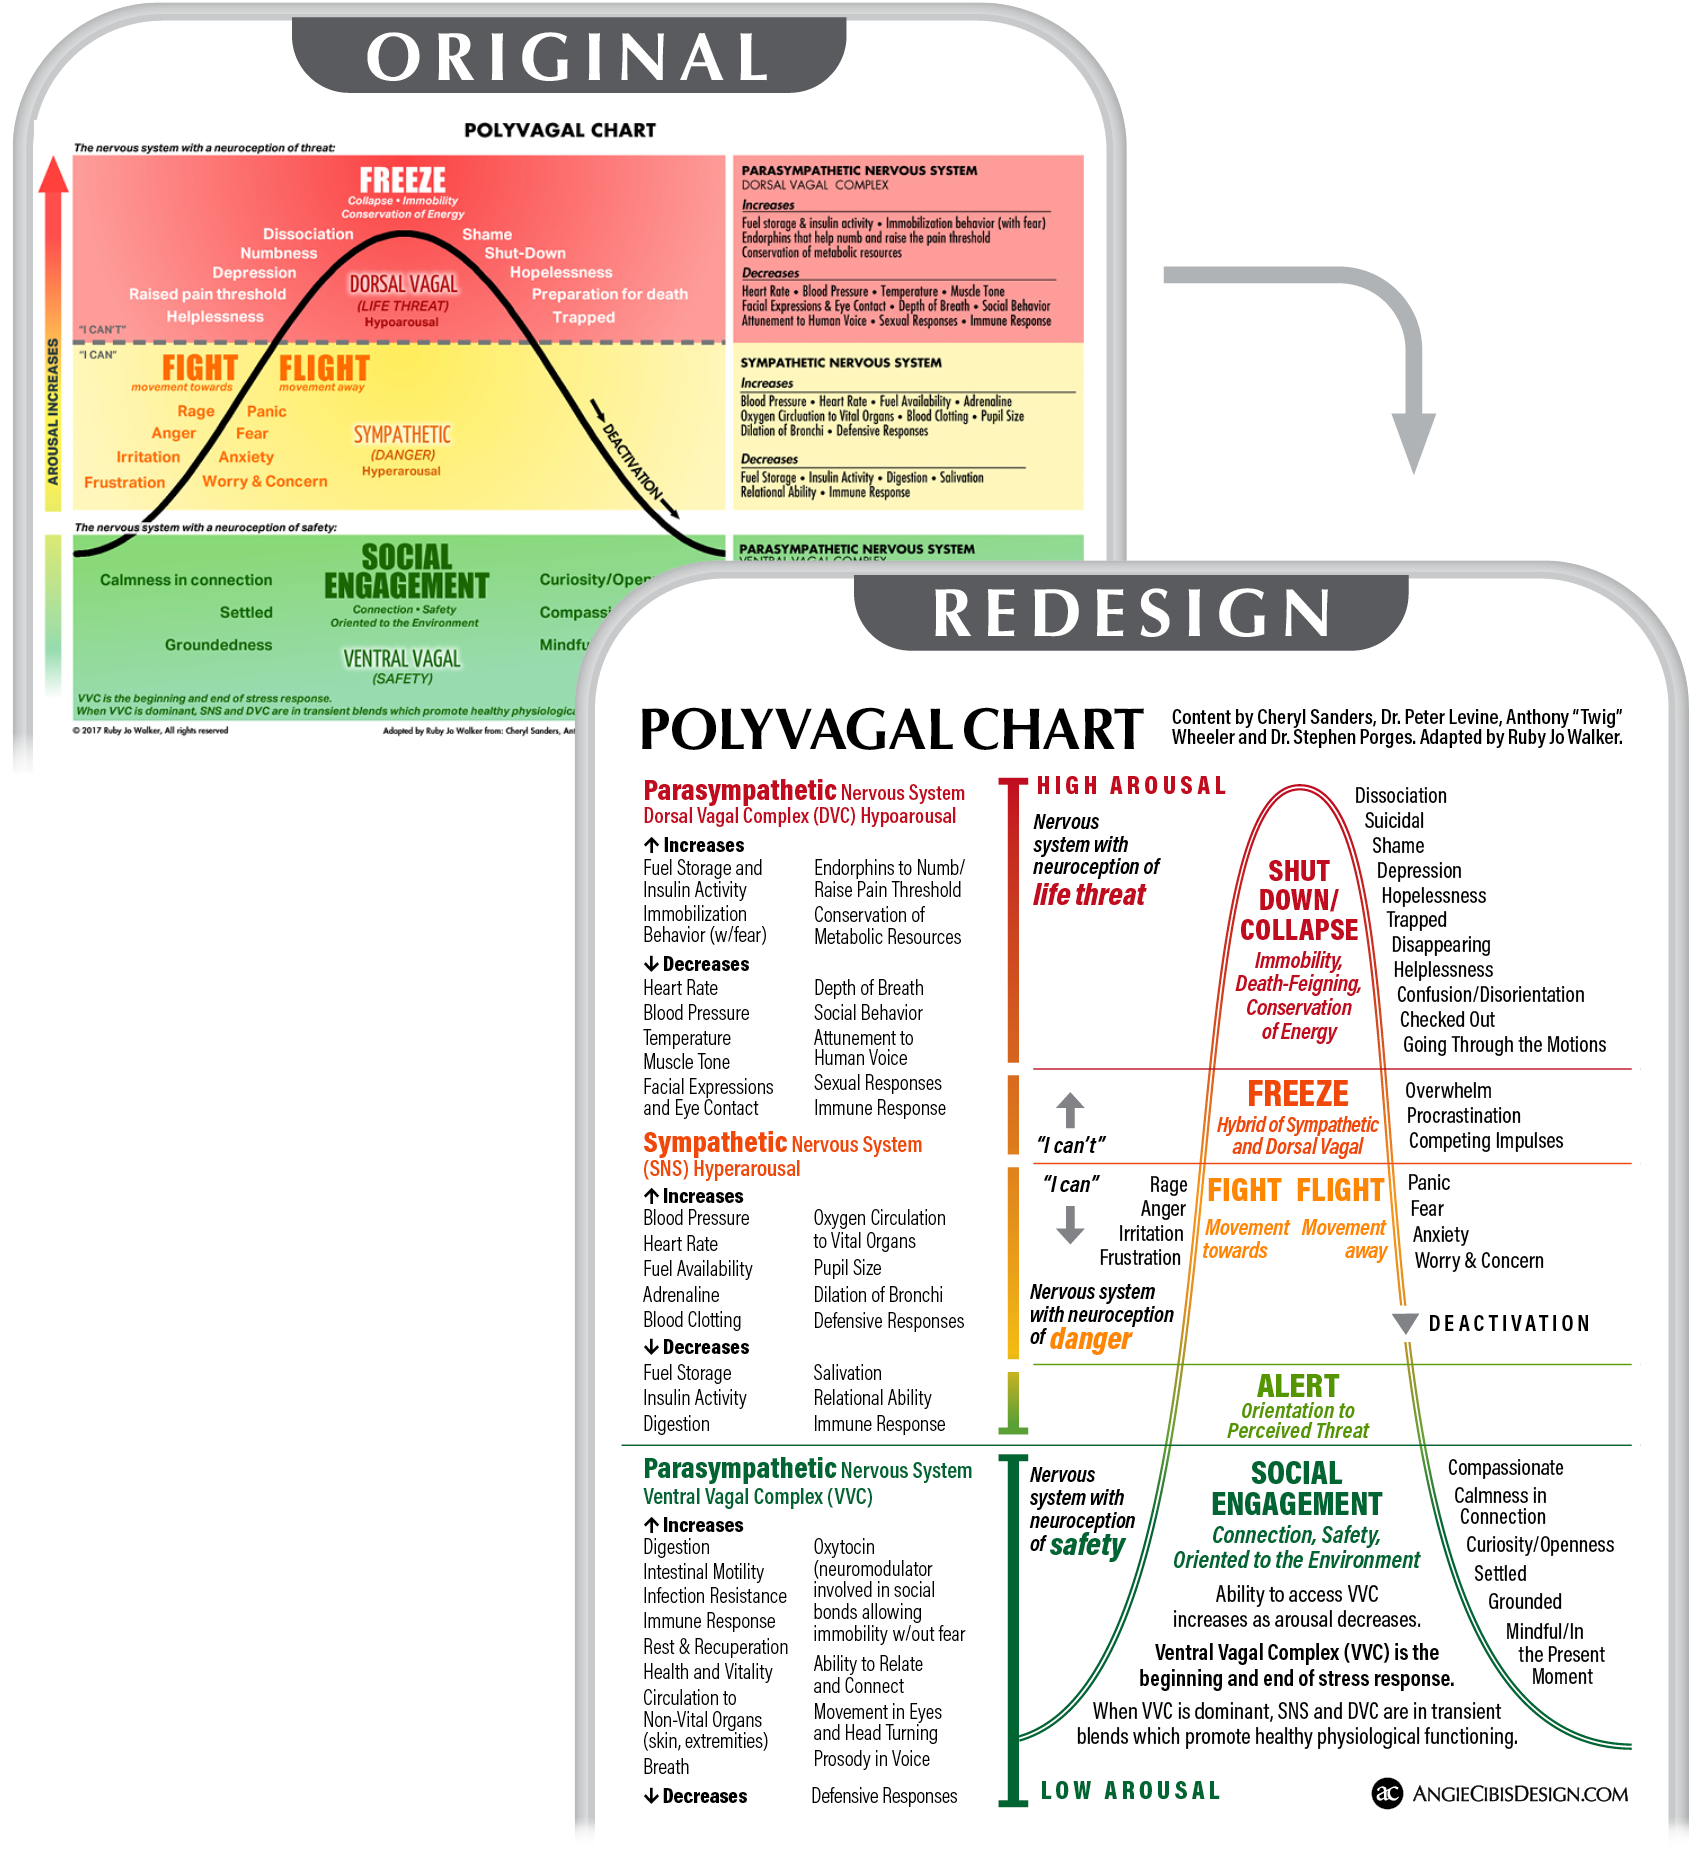
My redesigned Polyvagal Chart has been purchased internationally as a poster by both mental health professionals and general audiences across Ireland, Australia, England, Israel, Germany, Canada, and the United States via Redbubble.
TESTIMONIAL
“Angie’s scientific graphic design work is phenomenal. She is wonderful to work with! If you need illustrations or graphics for your papers and presentations, she will help you understand how to use data viz to your advantage, making sure your audience gets the message loud and clear.”
Alyssa Burgart, MD
Ethicist, Physician, and Clinical Professor of Anesthesiology at Stanford University